There are many things you must consider when planning your copay program, but one of the most important things is a step that is skipped by the majority of brand planners. To plan programs and project program cost you need to know what your patient’s OOP cost would be before the copay program. Many use an average out of pocket cost number for commercial patients along with an estimate of “percent covered patients” from the managed care team. This is a mistake resulting in a flawed analysis! If you use those two numbers as they are given to you, then you will severely underestimate your forecasted budget.
There are two big issues to consider here. First is the estimate of patients covered by commercial insurance. Many times, we have clients telling us that their coverage is “approximately 92%”. Your managed care team would love this to be the case, but with the high deductible health plans today, those numbers are just not close to being accurate anymore. With approx. 45% of all US households on HDHP’s, many patients must meet their out of pocket (OOP) deductible before they receive any benefits. That takes that 90%+ coverage number way down.
The second issue is related to the patient’s out of pocket cost. It is critical to move away from using an average patient OOP number and to translate your managed care contracts into a real breakdown of OOP costs for the patients who may try your brand.
What you should wind up with is a distribution like this:
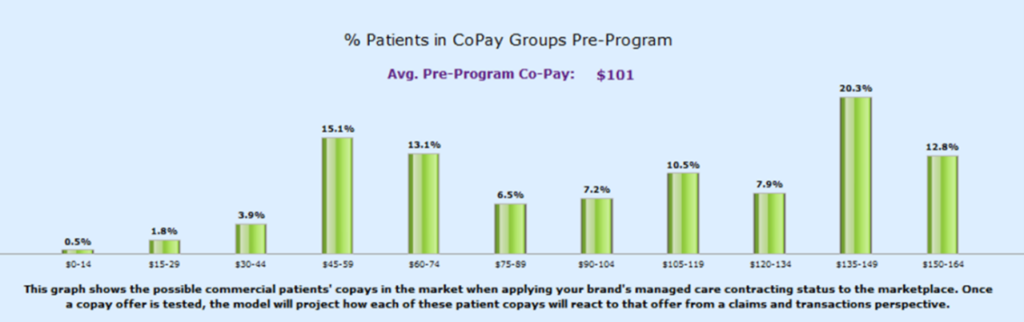
This shows the distribution of OOP costs for what we call your “pre-copay program patient universe” broken down into different “copay buckets” of OOP cost. You can see the distribution above as compared to the average pre-program copay. This measure looks at the average OOP for all of your possible patients in the market. Remember, the structure of your program will shape the distribution of patients which will impact your average OOP cost, which can turn out to be significantly higher or lower than the average OOP cost given to you by your managed care dept.
Only after you have a good understanding of what your OOP distribution looks like, can you begin to accurately forecast costs for your program going forward. If you use the average OOP overall for covered patients, you will most likely not address the percent of patients with copays much higher than that number. Or worse yet, you could structure your program and program cap in a way that leaves the door open to much higher payouts if you underestimate the real OOP costs.
It’s only when you can visualize the real situation your patients are facing that you can plan your program moving forward with any kind of accuracy. Hopefully, you can see how using an average patient OOP cost and an outdated percent coverage number will cause you all kinds of planning headaches!